


《中国康复理论与实践》 ›› 2024, Vol. 30 ›› Issue (8): 948-956.doi: 10.3969/j.issn.1006-9771.2024.08.010
周易文1, 钟亚平1,2( ), 魏梦力1,2, 王海锋1, 余绍华1, 桂辉贤1
收稿日期:2024-06-20
出版日期:2024-08-25
发布日期:2024-09-11
通讯作者:
钟亚平,男,博士,教授,主要研究方向:运动训练理论与实践。E-mail: zhongyaping@whsu.edu.cn
作者简介:周易文(1999-),女,汉族,湖南郴州市人,硕士研究生,主要研究方向:运动康复。
基金资助:
ZHOU Yiwen1, ZHONG Yaping1,2(), WEI Mengli1,2, WANG Haifeng1, YU Shaohua1, GUI Huixian1
Received:2024-06-20
Published:2024-08-25
Online:2024-09-11
Supported by:摘要:
目的 基于运动员前交叉韧带重建术(ACLR)术后的步态数据,分析其重返运动的风险。
方法 2023年5月至6月,在武汉体育学院招募ACLR术后运动员39例,采用三维动作捕捉系统、表面肌电和三维测力台,记录稳定步态和串联步态数据,并采用K-STARTS测试计算重返运动得分。各步态指标与K-STARTS测试总分之间的关系采用Pearson相关性分析,其中关键指标与重返运动的风险采用线性回归分析。
结果 在稳定步态中,步时与K-STARTS测试总分呈负相关(r = -0.479, P = 0.002),股直肌(r = 0.448, P = 0.004)和股外侧肌(r = 0.595, P = 0.001)的激活峰值振幅对称指数与K-STARTS测试总分均呈显著正相关。在串联步态中,重心横向位移距离与K-STARTS测试总分呈显著负相关(r = -0.341, P = 0.034),股外侧肌的激活峰值振幅出现时间对称指数与K-STARTS测试总分呈正相关(r = 0.320, P = 0.047)。回归分析显示,基于稳定步态构建的模型(F = 15.818, P = 0.001, R2 = 0.650)的解释度优于基于串联步态构建的模型(F = 7.692, P = 0.001, R2 = 0.397)。
结论 在稳定步态中,步态节奏变异性、对称性指标与重返运动风险相关;在串联步态中,步态平衡性、对称性指标与重返运动风险相关;相比于串联步态,基于稳定步态信息构建的重返运动风险评估模型的解释度更佳,可能更适合作为重返运动风险测试的简易方法。
中图分类号:
周易文, 钟亚平, 魏梦力, 王海锋, 余绍华, 桂辉贤. 基于运动员前交叉韧带重建术后步态数据分析重返运动的风险[J]. 《中国康复理论与实践》, 2024, 30(8): 948-956.
ZHOU Yiwen, ZHONG Yaping, WEI Mengli, WANG Haifeng, YU Shaohua, GUI Huixian. Risk assessment of return to sport based on gait data of athletes after anterior cruciate ligament reconstruction[J]. Chinese Journal of Rehabilitation Theory and Practice, 2024, 30(8): 948-956.
表1
一般资料"
| 性别 | n | 身高/cm | 体质量/kg | 年龄/岁 |
|---|---|---|---|---|
| 男 | 29 | 176.86±6.83 | 72.28±7.75 | 21.72±3.41 |
| 女 | 10 | 169.60±5.99 | 58.00±5.14 | 20.50±1.51 |

图1
K-STARTS测试"

表2
各步态指标无量纲化缩放计算方法"
| 指标 | 无量纲化缩放计算方法 |
|---|---|
| 速度类指标 | |
| 时间类指标 | |
| 肌电振幅类指标 | |
| 关节角度类指标 | 原值 |
| 距离类指标 |
表3
稳定步态、串联步态指标与K-STARTS得分的两两相关性"
| 变量 | 稳定步态 | 串联步态 | |||
|---|---|---|---|---|---|
| r值 | P值 | r值 | P值 | ||
| SL | 0.066 | 0.688 | |||
| ST | -0.479 | 0.002 | -0.155 | 0.347 | |
| SS | 0.242 | 0.138 | 0.195 | 0.233 | |
| SL SD | -0.208 | 0.203 | |||
| ST SD | -0.223 | 0.172 | 0.186 | 0.258 | |
| SS SD | -0.198 | 0.226 | 0.167 | 0.309 | |
| COM LDD | 0.028 | 0.868 | -0.341 | 0.034 | |
| COM LDS | 0.107 | 0.517 | -0.109 | 0.508 | |
| COP LDD | 0.092 | 0.575 | 0.019 | 0.908 | |
| COP LDS | 0.227 | 0.165 | 0.073 | 0.659 | |
| KJA IC | 0.091 | 0.581 | 0.189 | 0.250 | |
| HJA IC | -0.149 | 0.365 | -0.127 | 0.441 | |
| Min KFA SP | -0.036 | 0.828 | -0.091 | 0.582 | |
| Min HFA SP | -0.163 | 0.322 | 0.055 | 0.740 | |
| SI PAA-VM | 0.029 | 0.863 | -0.108 | 0.512 | |
| SI PAA-RF | 0.448 | 0.004 | -0.110 | 0.504 | |
| SI PAA-VL | 0.595 | 0.001 | 0.043 | 0.795 | |
| SI PAA-BF | 0.027 | 0.871 | -0.072 | 0.665 | |
| SI PAA-TA | 0.081 | 0.622 | 0.133 | 0.418 | |
| SI PAA-GM | 0.115 | 0.486 | -0.275 | 0.090 | |
| SI PAA-GL | -0.103 | 0.531 | 0.060 | 0.685 | |
| SI TPAA-VM | -0.073 | 0.658 | -0.300 | 0.064 | |
| SI TPAA-RF | 0.124 | 0.453 | 0.080 | 0.628 | |
| SI TPAA-VL | 0.194 | 0.238 | 0.320 | 0.047 | |
| SI TPAA-BF | 0.225 | 0.168 | 0.066 | 0.688 | |
| SI TPAA-TA | -0.057 | 0.731 | 0.021 | 0.898 | |
| SI TPAA-GM | 0.096 | 0.561 | -0.016 | 0.925 | |
| SI TPAA-GL | -0.120 | 0.465 | -0.192 | 0.243 | |
表4
稳定步态模型构建结果"
| 预测变量 | 非标准化系数 | β | t值 | P值 | |
|---|---|---|---|---|---|
| B | 标准误 | ||||
| 常数 | 15.748 | 6.109 | 2.578 | 0.014 | |
| ST | -3.226 | 1.451 | -0.250 | -2.251 | 0.031 |
| SI PAA-RF | 1.835 | 0.630 | 0.319 | 2.912 | 0.006 |
| SI PAA-VL | 2.658 | 1.086 | 0.291 | 2.448 | 0.020 |
| ACL-RSI | 1.767 | 0.478 | 0.396 | 3.699 | 0.001 |

图2
基于稳定步态信息的重返运动风险评估模型的预测值与实际值残差分布P-P图"
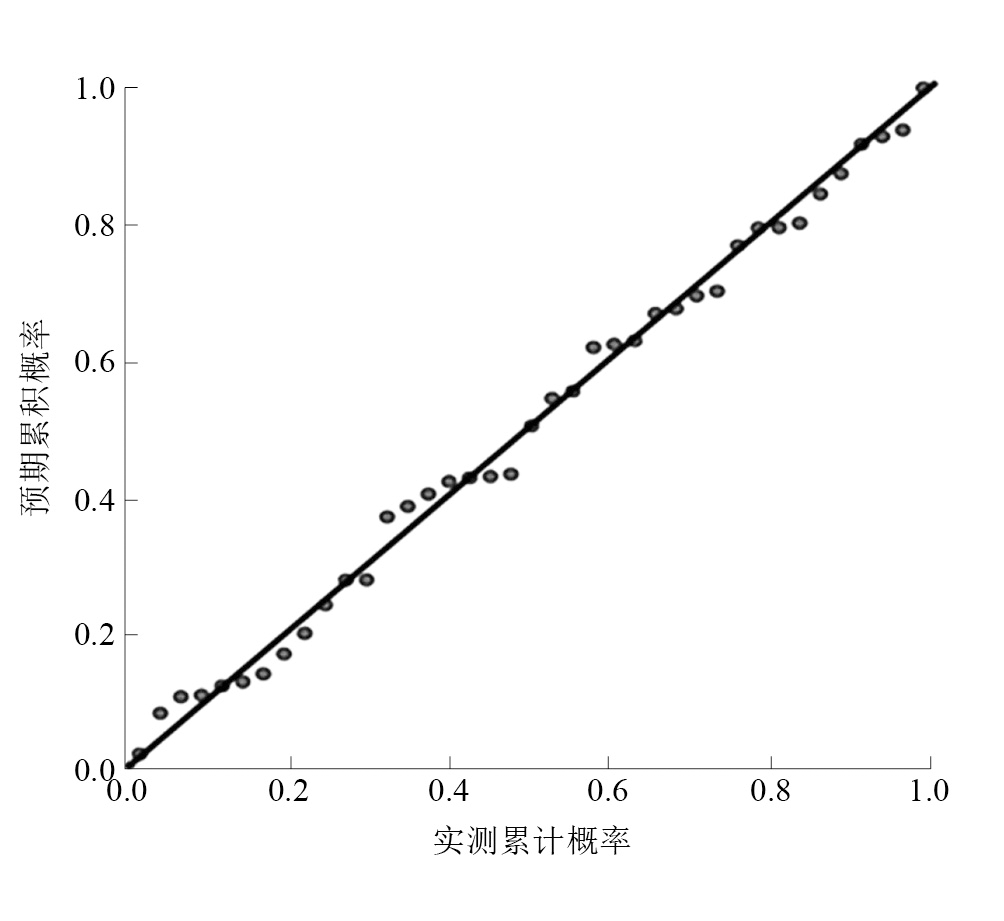
表5
串联步态模型构建结果"
| 预测变量 | 非标准化系数 | β | t值 | P值 | |
|---|---|---|---|---|---|
| B | 标准误 | ||||
| 常数 | 9.744 | 1.891 | 5.152 | 0.001 | |
| COM LDD | -9995.523 | 5630.445 | -0.242 | -21.775 | 0.085 |
| SI TPAA-VL | 0.678 | 0.397 | 0.232 | 1.707 | 0.097 |
| ACL-RSI | 1.968 | 0.630 | 0.437 | 3.125 | 0.004 |

图3
基于串联步态信息的重返运动风险评估模型的预测值与实际值残差分布P-P图"

| [1] | KOTSIFAKI R, SIDERIS V, KING E, et al. Performance and symmetry measures during vertical jump testing at return to sport after ACL reconstruction[J]. Br J Sports Med, 2023, 57(20): 1304-1310. |
| [2] | 魏铭, 牛雪松, 李楠. 徐梦桃前交叉韧带重建术后康复训练的应用与分析[J]. 体育科学, 2021, 41(8): 25-33. |
| WEI M, NIU X S, LI N. Application and analysis of rehabilitation training for Xu Mengtao after anterior cruciate ligament reconstruction[J]. Sports Sci, 2021, 41(8): 25-33. | |
| [3] | TURK R, SHAH S, CHILTON M, et al. Return to sport after anterior cruciate ligament reconstruction requires evaluation of > 2 functional tests, psychological readiness, quadriceps/hamstring strength, and time after surgery of 8 months[J]. Arthroscopy, 2023, 39(3): 790-801. |
| [4] | SLATER L V, HART J M, KELLY A R, et al. Progressive changes in walking kinematics and kinetics after anterior cruciate ligament injury and reconstruction: a review and meta-analysis[J]. J Athl Train, 2017, 52(9): 847-860. |
| [5] | GOKELER A, GRASSI A, HOOGESLAG R, et al. Return to sports after ACL injury 5 years from now: 10 things we must do[J]. J Exp Orthop, 2022, 9(1): 73. |
| [6] | WELLING W. Return to sports after an ACL reconstruction in 2024: A glass half full? A narrative review[J]. Physic Thera Sport, 2024, 67: 141-148. |
| [7] | SINSURIN K, KIRATISIN P, IRAWAN D S, et al. Residual deficits of knee and hip joint coordination and clinical performance after return to sports in athletes with anterior cruciate ligament reconstruction[J]. Knee Surg Relat Res, 2024, 36(1): 22. |
| [8] | ORONOWICZ J, SEIL R, HRTERER H, et al. Anterior cruciate ligament injuries in elite ski jumping reliably allow return to competition but severely affect future top performance[J]. Knee Surg Sports Traumatol Arthrosc, 2024, 32(3): 616-622. |
| [9] | JACK R A, LAMBERT B S, HEDT C A, et al. Blood flow restriction therapy preserves lower extremity bone and muscle mass after ACL reconstruction[J]. Sports Health, 2023, 15(3): 361-371. |
| [10] | SAYER T A, MENCK N V, RERA J, et al. Is it time to develop specific return to running criteria for ACL rehabilitation? An international survey of physiotherapists criteria for return to running following ACL injury[J]. Phys Thera Sport, 2024, 67: 19-24. |
| [11] |
FRANCK F, SAITHNA A, VIEIRA T D, et al. Return to sport composite test after anterior cruciate ligament reconstruction (K-STARTS): factors affecting return to sport test score in a retrospective analysis of 676 patients[J]. Sports Health, 2021, 13(4): 364-372.
doi: 10.1177/1941738120978240 pmid: 33550916 |
| [12] |
BLAKENEY W G, OUANEZAR H, ROGOWSKI I, et al. Validation of a composite test for assessment of readiness for return to sports after anterior cruciate ligament reconstruction: the K-STARTS test[J]. Sports Health, 2018, 10(6): 515-522.
doi: 10.1177/1941738118786454 pmid: 30024344 |
| [13] | JOHNOSON J L, CAPIN J J, ARUNDALE A J H, et al. A secondary injury prevention program may decrease contralater al anterior cruciate ligament injuries in female athletes: 2-year injury rates in the ACL-SPORTS randomized controlled trial[J]. J Orthop Sports Phys Ther, 2020, 50(9): 523-530. |
| [14] |
MANIAR N, COLE M H, BRYANT A L, et al. Muscle force contributions to anterior cruciate ligament loading[J]. Sports Med, 2022, 52(8): 1737-1750.
doi: 10.1007/s40279-022-01674-3 pmid: 35437711 |
| [15] | CHIA L, DE D, WHALAN M, et al. Non-contact anterior cruciate ligament injury epidemiology in team-ball sports: a systematic review with meta-analysis by sex, age, sport, participation level, and exposure type[J]. Sports Med, 2022, 52(10): 2447-2467. |
| [16] | READ P, MC AULIFFE S, WILSON M G, et al. Better reporting standards are needed to enhance the quality of hop testing in the setting of ACL return to sport decisions: a narrative review[J]. Br J Sports Med, 2021, 55(1): 23-29. |
| [17] | NAMBI G, ABDELBASSET W K, VERMA A, et al. Effects of postoperative rehabilitation on gait parameters and electromyography variables in acute and chronic anterior cruciate ligament reconstruction surgery in football players[J]. Evid Based Complement Alternat Med, 2021, 13: 9912795. |
| [18] | MINNING S J, MYER G D, MANGINE R E, et al. Serial assessments to determine normalization of gait following anterior cruciate ligament reconstruction[J]. Scand J Med Sci Sports, 2009, 19(4): 569-575. |
| [19] |
DI STASI S L, LOGERSTEDT D, GARDINIER E S, et al. Gait patterns differ between ACL-reconstructed athletes who pass return-to-sport criteria and those who fail[J]. Am J Sports Med, 2013, 41(6): 1310-1318.
doi: 10.1177/0363546513482718 pmid: 23562809 |
| [20] |
时会娟, 丁立, 任爽, 等. 前交叉韧带重建术后步行过程中的生物力学特征[J]. 科技导报, 2020, 38(6): 25-33.
doi: 10.3981/j.issn.1000-7857.2020.06.003 |
| SHI H J, DING L, REN S, et al. Biomechanical characteristics of walking after anterior cruciate ligament reconstruction[J]. Sci Technol Rev, 2020, 38(6): 25-33. | |
| [21] | ZARZYCKI R, FAILLA M, CAPIN J J, et al. Psychological readiness to return to sport is associated with knee kinematic asymmetry during gait following anterior cruciate ligament reconstruction[J]. J Orthop Sports Phys Ther, 2018, 48(12): 968-973. |
| [22] | SIMONSSON R, PIUSSI R, HGBERG J, et al. Rehabilitation and return to sport after anterior cruciate ligament reconstruction[J]. Clin Sports Med, 2024, 43(3): 513-533. |
| [23] | ADHITYA I P G S, YU W Y, KURNIAWATI I, et al. Risk factors of knee reinjury after anterior cruciate ligament reconstruction[J]. Int Ortho, 2024, 48(4): 983-990. |
| [24] | 王玲, 姜霞, 陈鹏, 等. 前交叉韧带重建患者双腿垂直跳跃期间的下肢生物力学特征[J]. 中国组织工程研究, 2024, 28(14): 2215-2220. |
| WANG L, JIANG X, CHEN P, et al. Lower limb biomechanical characteristics during vertical jump of both legs in patients undergoing anterior cruciate ligament reconstruction[J]. Chin J Tiss Eng Res, 2024, 28(14): 2215-2220. | |
| [25] | 周敬滨, 李国平, 李方祥. 慢性膝关节前交叉韧带损伤患者步态的运动学分析[J]. 中国运动医学杂志, 2012, 31(10): 898-901, 912. |
| ZHOU J B, LI G P, LI F X. Patients with chronic knee anterior cruciate ligament injury gait kinematics analysis[J]. Chin J Sports Med, 2012, 31(10): 898-901, 912. | |
| [26] |
YOO D, KANG K C, LEE J H, et al. Diagnostic usefulness of 10-step tandem gait test for the patient with degenerative cervical myelopathy[J]. Sci Rep, 2021, 11(1): 17212.
doi: 10.1038/s41598-021-96725-6 pmid: 34446786 |
| [27] |
GRINBERG Y, BERKOWITZ S, HERSHKOVITZ L, et al. The ability of the instrumented tandem walking tests to discriminate fully ambulatory people with MS from healthy adults[J]. Gait Posture, 2019, 70: 90-94.
doi: S0966-6362(18)31844-7 pmid: 30831545 |
| [28] | 李玉周, 王婧怡, 胡军. 前交叉韧带重建术后短期足底压力分布及平衡特征研究[J]. 体育科学, 2020, 40(5): 8. |
| LI Y Z, WANG J Y, HU J. Short-term plantar pressure distribution and balance characteristics after anterior cruciate ligament reconstruction[J]. Sport Sci, 2020, 40(5): 8. | |
| [29] | 王奇奇, 徐朱杰, 冯德宏, 等. 步态分析在前交叉韧带损伤中的应用[J]. 实用骨科杂志, 2021, 27(12): 1112-1116. |
| [30] | ZARZYCKI R, CUMMER K, ARHOS E, et al. Female athletes with better psychological readiness are at higher risk for second acl injury after primary ACL reconstruction[J]. Sports Health, 2024, 16(1): 149-154. |
| [31] |
KOBSAR D, OSIS S T, PHINYOMARK A, et al. Reliability of gait analysis using wearable sensors in patients with knee osteoarthritis[J]. J Biomech, 2016, 49(16): 3977-3982.
doi: S0021-9290(16)31226-X pmid: 27889189 |
| [32] |
HADIZADEH M, AMRI S, ROOHI SA, et al. Assessment of gait symmetry improvements in national athletes after anterior cruciate ligament reconstruction during rehabilitation[J]. Int J Sports Med, 2016, 37(12): 997-1002.
pmid: 27551935 |
| [33] |
魏梦力, 钟亚平, 周易文, 等. 单侧前交叉韧带重建患者步行双侧下肢肌肉协同模式差异[J]. 中国康复理论与实践, 2024, 30(1): 95-104.
doi: 10.3969/j.issn.1006-9771.2024.01.013 |
| WEI M L, ZHONG Y P, ZHOU Y W, et al. Patients with unilateral anterior cruciate ligament reconstruction on bilateral lower limb muscle coordination patterns differences[J]. Chin Rehabil Theory Pract, 2024, 30(1): 95-104. | |
| [34] |
VISSCHER R M S, SANSGIRI S, FRESLIER M, et al. Towards validation and standardization of automatic gait event identification algorithms for use in paediatric pathological populations[J]. Gait Posture, 2021, 86: 64-69.
doi: 10.1016/j.gaitpost.2021.02.031 pmid: 33684617 |
| [35] | CLARK D J. Automaticity of walking: functional significance, mechanisms, measurement and rehabilitation strategies[J]. Front Hum Neurosci, 2015, 5(9): 246. |
| [36] | SHARIFI A, ESMAEILI H, ZOLAKTAF V. Walking and running roll-off characteristics in patients with ACL reconstruction history[J]. Gait Posture, 2024, 107: 330-336. |
| [37] | 马圣楠, 柯竟悦, 董洪铭, 等. 前交叉韧带重建后静态站立及步行时的平衡和步态特征[J]. 中国组织工程研究, 2023, 27(36): 5784-5789. |
| MA S N, KE J Y, DONG H M, et al. Static standing and walking after anterior cruciate ligament reconstruction of balance and gait features[J]. J Tiss Eng Res Chin, 2023, 27(36): 5784-5789. | |
| [38] |
GOKELER A, NEUHAUS D, BENJAMINSE A, et al. Principles of motor learning to support neuroplasticity after ACL Injury: implications for optimizing performance and reducing risk of second ACL injury[J]. Sports Med, 2019, 49(6): 853-865.
doi: 10.1007/s40279-019-01058-0 pmid: 30719683 |
| [39] | 张美珍. 非接触性前交叉韧带损伤危险因素的生物力学研究[D]. 北京: 北京体育大学, 2012. |
| ZHANG M Z. Biomechanical study on risk factors of non-contact anterior cruciate ligament injury[D]. Beijing: Beijing Sport University, 2012. | |
| [40] | MANTASHLOO Z, LETAFATKAR A, MORADI M. Vertical ground reaction force and knee muscle activation asymmetries in patients with ACL reconstruction compared to healthy individuals[J]. Knee Surg Sports Traumatol Arthrosc, 2020, 28(6): 2009-2014. |
| [1] | 唐乐天, 黄兆欣, 刘超, 肖晓飞. 前交叉韧带重建术后患者高血流限制训练康复效果的系统综述[J]. 《中国康复理论与实践》, 2024, 30(7): 789-796. |
| [2] | 温娜娜, 张芯慧, 龙清, 王雨豪, 余群萍, 张晗淳, 郑国华. 步态和平衡功能对上海社区老年人衰弱的预测效能[J]. 《中国康复理论与实践》, 2024, 30(6): 731-736. |
| [3] | 郑建玲, 刘惠林, 朱琳, 顾彬, 颜如秀, 赵圻, 宋鲁平. 早期悬吊保护下智能助行训练对脑卒中后运动和行走功能的效果[J]. 《中国康复理论与实践》, 2024, 30(4): 431-436. |
| [4] | 于春洋, 刘然, 赵依双, 郭帅, 周亚楠, 李丽, 张皓. 虚拟现实联合跑台训练对脑卒中患者平衡功能和步行能力的效果[J]. 《中国康复理论与实践》, 2024, 30(3): 310-315. |
| [5] | 葛颖, 赵沃娃, 张路, 舒璇, 李佳蔚, 刘颖. 帕金森病伴冻结步态患者的运动功能和生活质量[J]. 《中国康复理论与实践》, 2024, 30(3): 339-344. |
| [6] | 马乾峰, 李立, 张伟, 丁健, 许贻林, 毛文慧. 不同硬度地面对功能性踝关节不稳患者步态协调性的影响[J]. 《中国康复理论与实践》, 2024, 30(3): 345-351. |
| [7] | 魏梦力, 钟亚平, 周易文, 桂辉贤, 关烨明, 于婷婷. 单侧前交叉韧带重建患者步行双侧下肢肌肉协同模式差异[J]. 《中国康复理论与实践》, 2024, 30(1): 95-104. |
| [8] | 赵盼超, 纪仲秋, 姜桂萍, 文蕊香. 不同任务干扰对儿童早期步态特征和任务成本的影响[J]. 《中国康复理论与实践》, 2023, 29(9): 1072-1082. |
| [9] | 胡晓诗, 张琦, 岳青, 梁艳华, 李晓松, 冯啊美, 张燕庆. 矫形弹力绷带对痉挛性偏瘫脑性瘫痪患儿步态对称性和步行能力的效果[J]. 《中国康复理论与实践》, 2023, 29(9): 1083-1089. |
| [10] | 马圣楠, 柯竟悦, 董洪铭, 李建萍, 张洪浩, 刘超, 沈双, 李古强. 核心稳定性训练干预前交叉韧带重建术后动态平衡及表面肌电的效果[J]. 《中国康复理论与实践》, 2023, 29(8): 882-889. |
| [11] | 张意彬, 吕杰, 喻洪流. 基于模糊逻辑算法的智能膝关节假肢步态相位识别[J]. 《中国康复理论与实践》, 2023, 29(8): 896-902. |
| [12] | 韩亚兵, 刘少青, 李新通, 梁馨文, 罗敬, 李婷, 潘玮敏. 髋部神经肌肉训练对女子足球运动员前交叉韧带损伤风险的影响[J]. 《中国康复理论与实践》, 2023, 29(7): 770-776. |
| [13] | 王一吉, 周红俊, 何泽佳, 刘根林, 郑樱, 郝春霞, 卫波, 康海琼, 张缨, 逯晓蕾, 袁媛, 蒙倩茹. 不完全性脊髓损伤患者运动功能对称性与步态对称性的关系[J]. 《中国康复理论与实践》, 2023, 29(6): 639-645. |
| [14] | 张意彬, 李剑峰, 喻洪流. 一种智能膝关节假肢及其步态对称性评价[J]. 《中国康复理论与实践》, 2023, 29(4): 402-407. |
| [15] | 王芳, 杨涛, 何耀广, 曹子君, 刘国庆, 胡军, 张建国, 樊瑜波. 基于糖尿病患者步态周期足底压力的变刚度鞋垫设计[J]. 《中国康复理论与实践》, 2023, 29(4): 408-415. |
| 阅读次数 | ||||||
|
全文 |
|
|||||
|
摘要 |
|
|||||
|
||